TotalCtrl: From Chaos to Clarity
Building a restaurant inventory platform from the ground up
Restaurants managed inventory through a combination of experience, memory, and spreadsheets.
Inventory counts happened once a month - someone would walk through storage areas with pen and paper, writing down quantities of ingredients across multiple locations and then re-type everything into a spreadsheet.
Purchasing decisions based on intuition rather than data contributed to over-ordering and food waste.
The bottleneck wasn't the count itself. It was everything after.
Before any financial reporting could happen, staff had to manually match those inventory numbers against supplier invoices to get up-to-date cost data - only then could the kitchen calculate COGS and generate accounting reports. In hospitality, COGS is one of the primary levers for profitability. Wasted stock and slow reconciliation both hit the same number.
Each manual step introduced delays, errors, and dependency on whoever held the institutional knowledge.
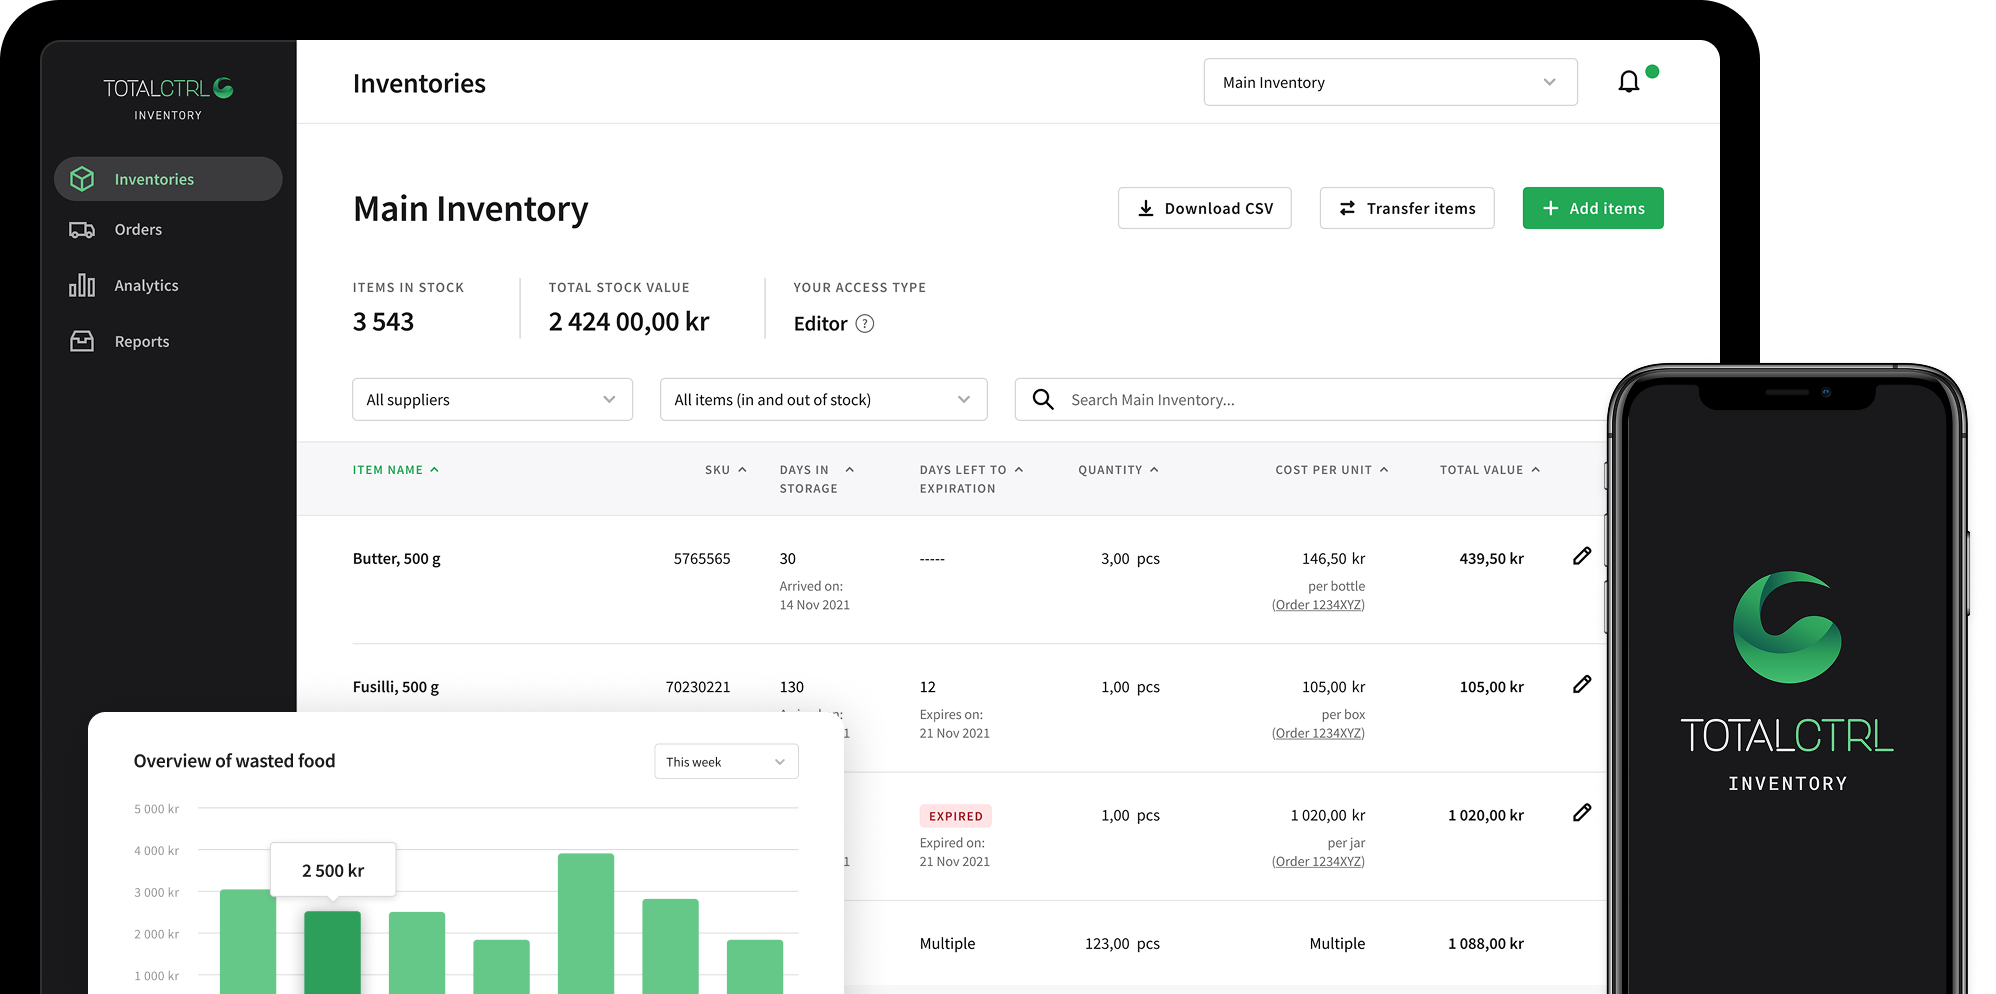
The product focused on eliminating the reconciliation work surrounding the stock count: building a shared operational layer where kitchen staff, managers, and accountants worked from the same data without manual handoffs.
The platform supported four distinct roles:
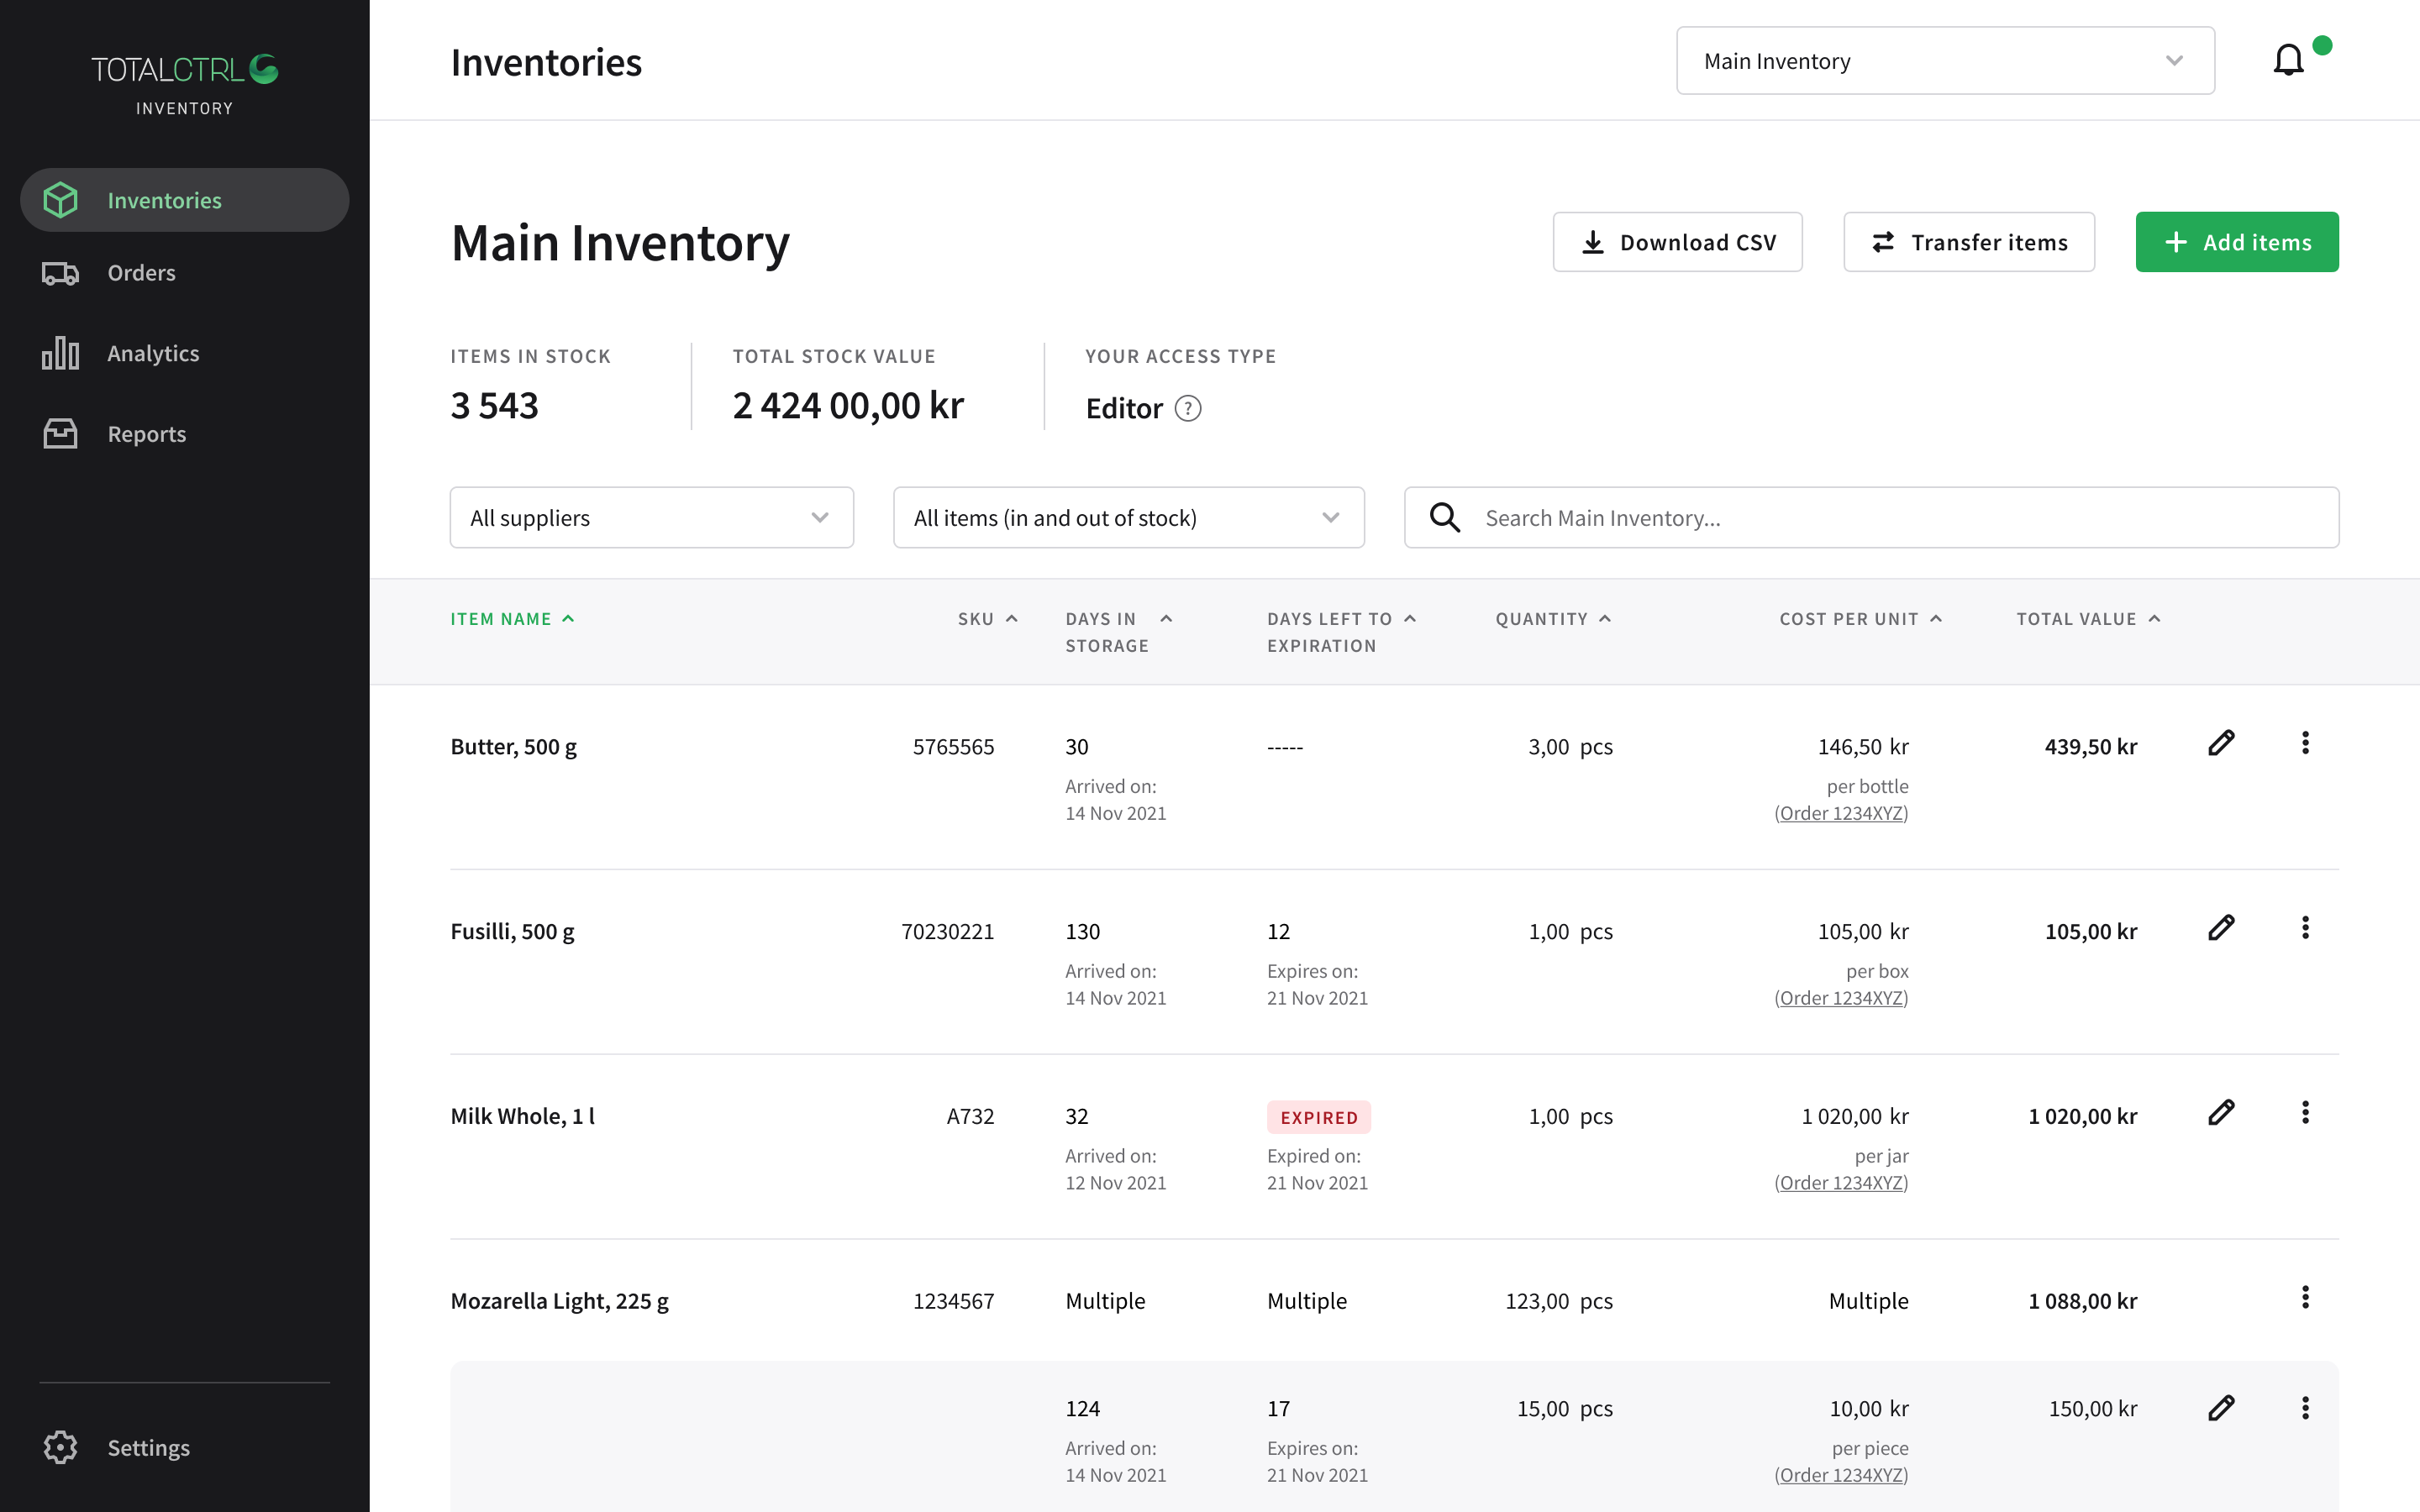
The web platform replaced fragmented spreadsheets with a structured inventory system. One dataset supported the entire workflow.
The obvious starting point was barcode scanning. We ruled it out - most produce arrives fresh and loose without barcodes, and available ingredient databases were too incomplete to be reliable.
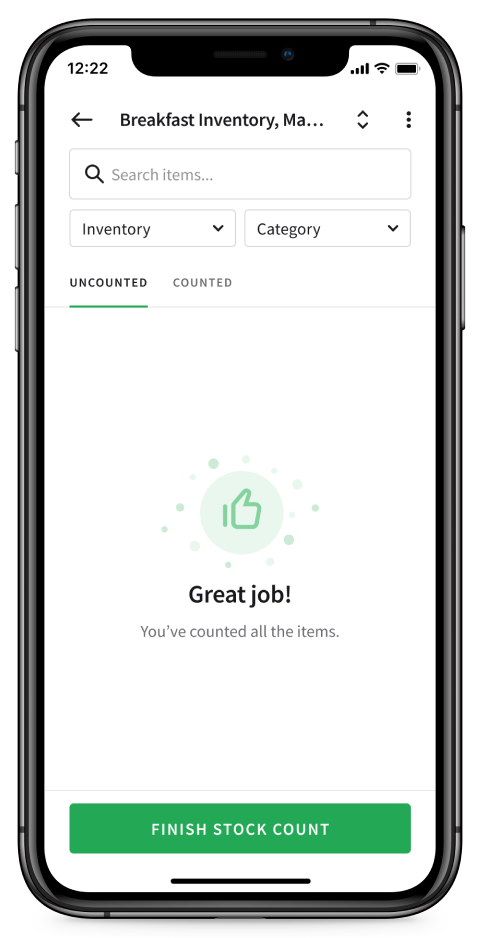
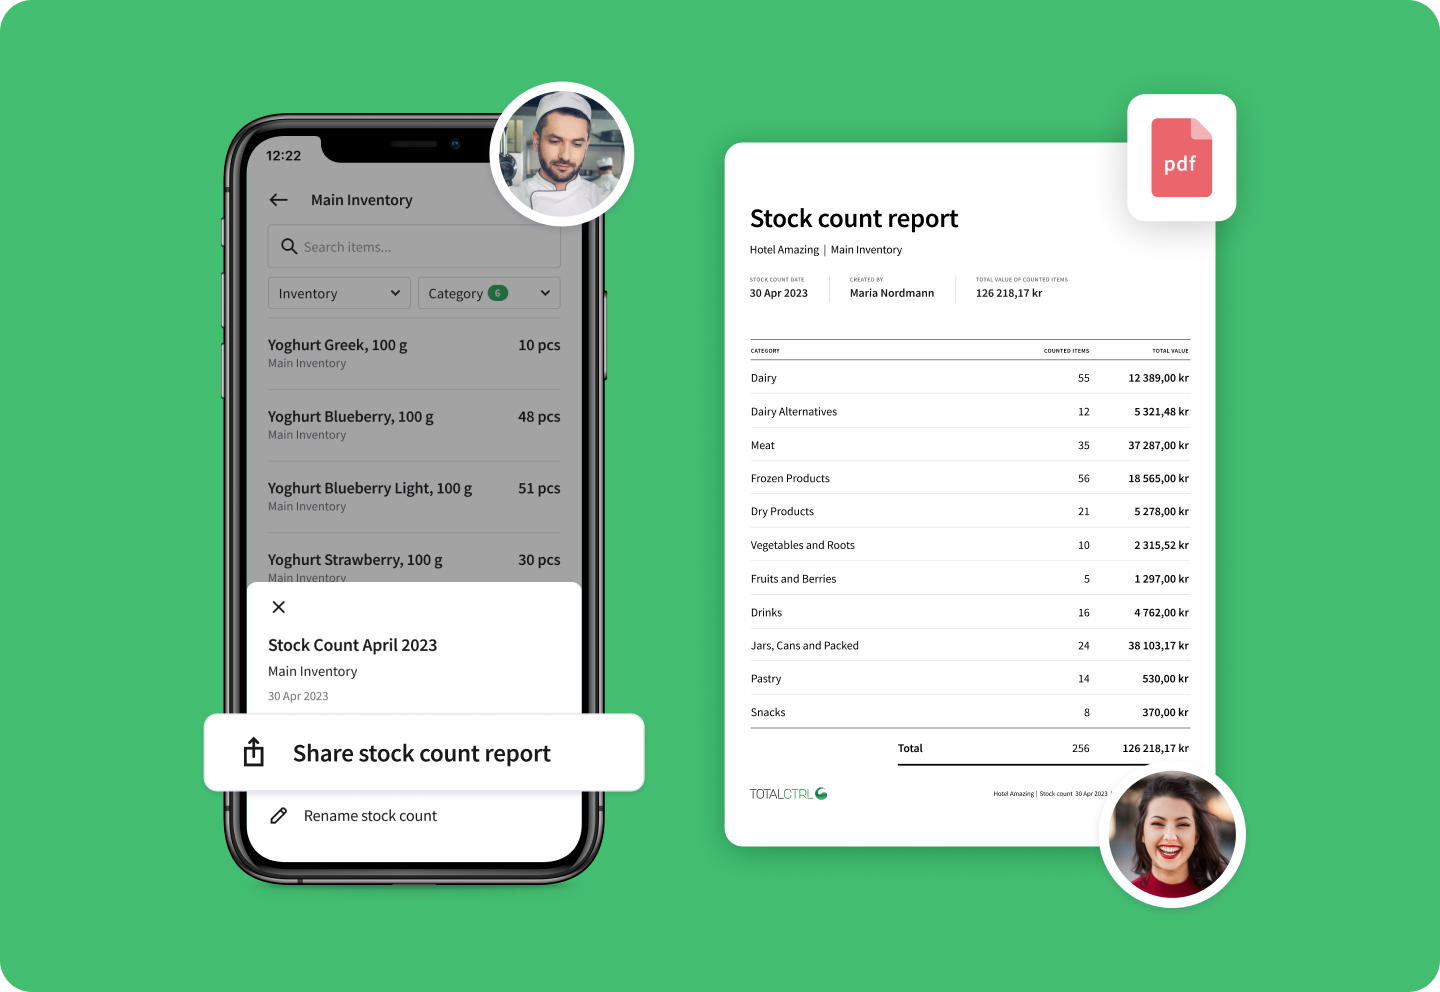
Staff had been using paper for counts - mobile was the natural replacement. With barcode scanning ruled out, search became the primary interaction.
Partial string matching meant typing the first few characters returned results immediately, without needing to know exact supplier naming or scroll through a full list.
The count flow moved items from uncounted to counted, giving staff a clear overview of what is still left to count.
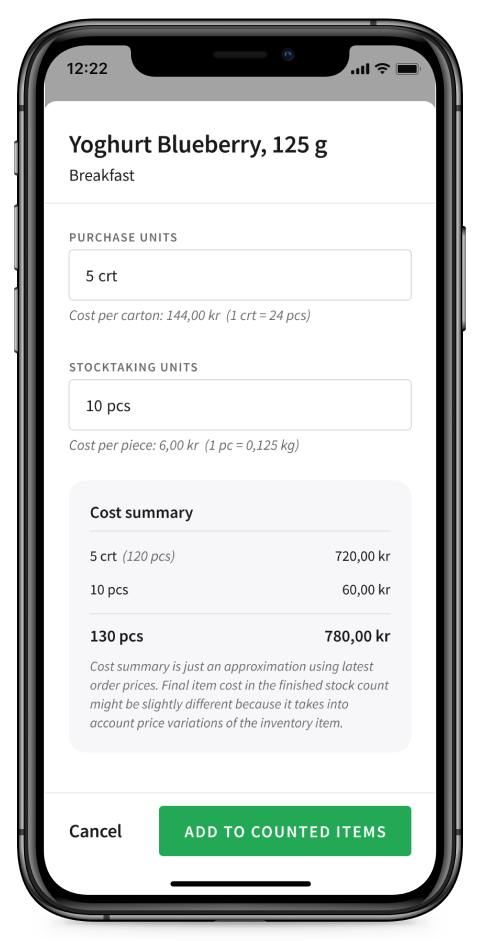
Units were the harder problem. Staff might count a full carton, loose packages, and individual items in the same session. We supported three unit layers - base, purchase, and stocktaking - each carrying its own cost, so the system absorbed the messiness of physical storage rather than forcing mental conversion before entry. Resolving cost per unit at input prevented downstream reconciliation errors where the same ingredient appeared at conflicting values.
Counts could be filtered by category - allowing high-value or high-turnover items like meat, alcohol, or dairy to be counted independently, as often as needed.


Previously, generating inventory reports meant manually preparing spreadsheets. With the digital system, reports were created automatically once stock counts were completed.
"I used to spend a whole day doing stock counts, now I use a maximum of 3 hours." - Head Chef at a popular lunch spot, Stavanger, Norway
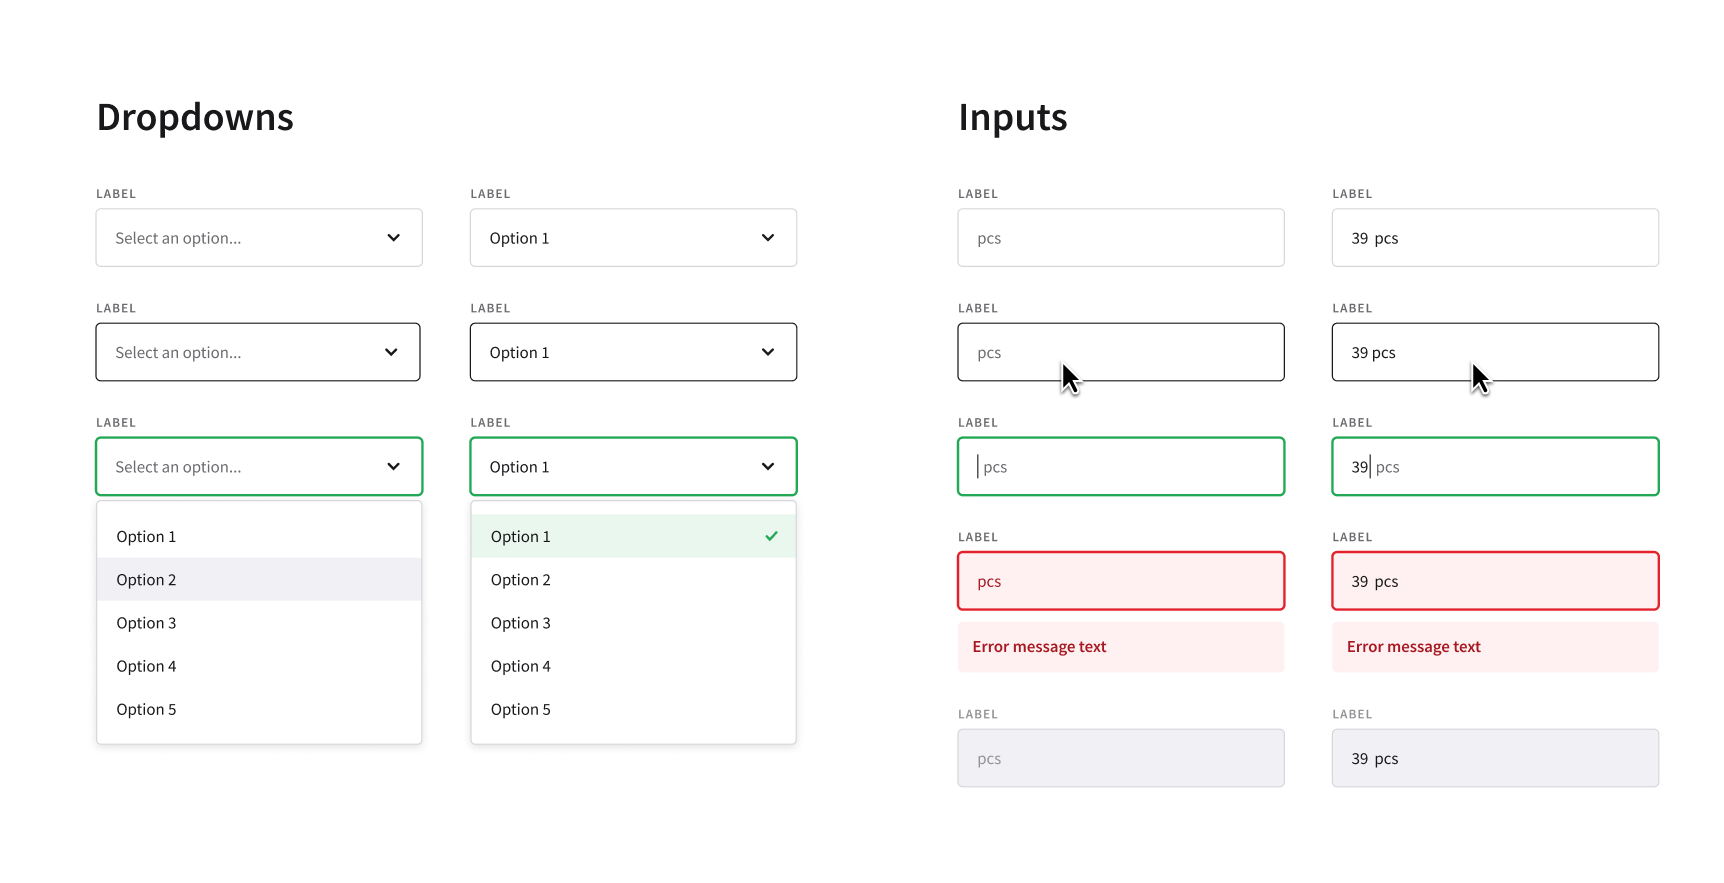
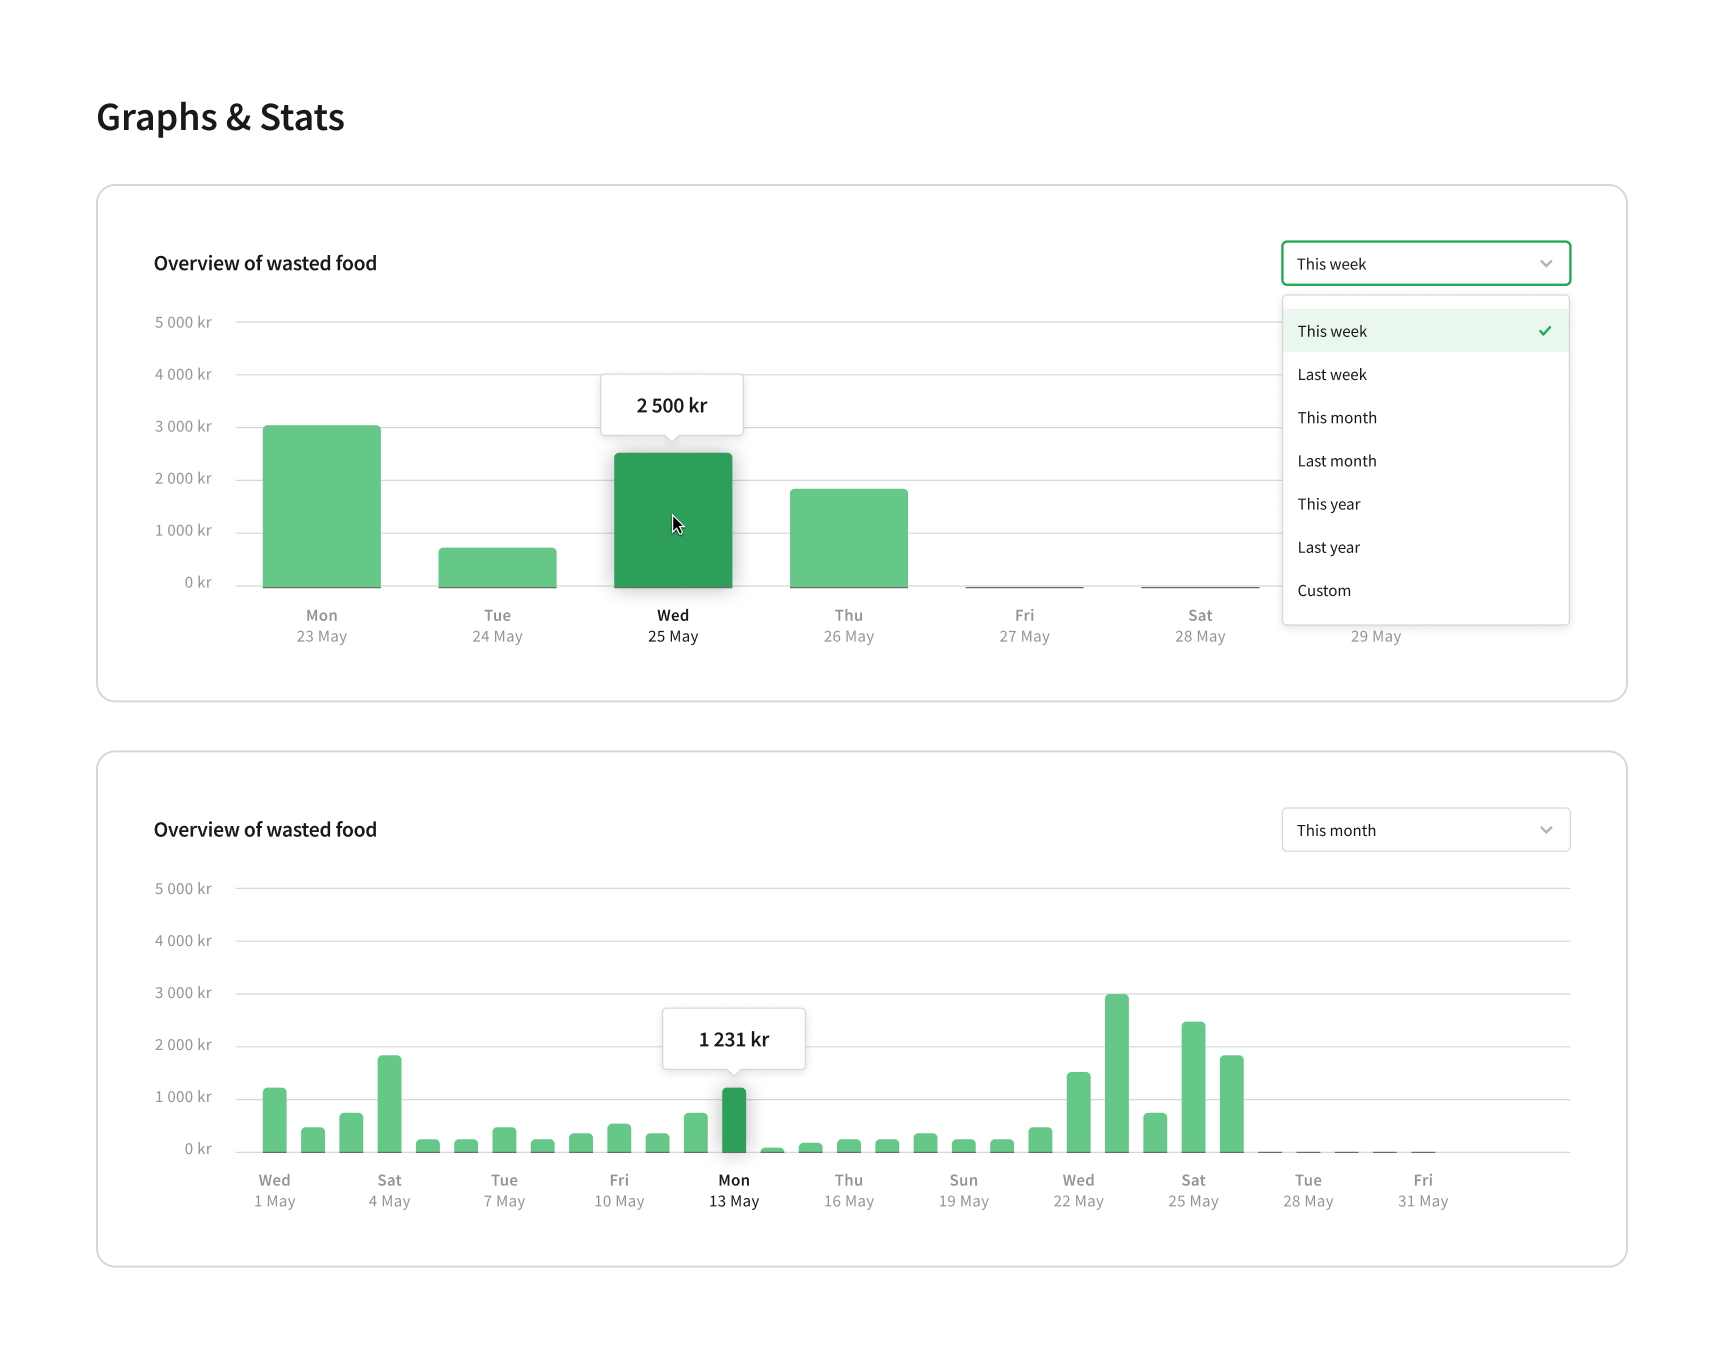
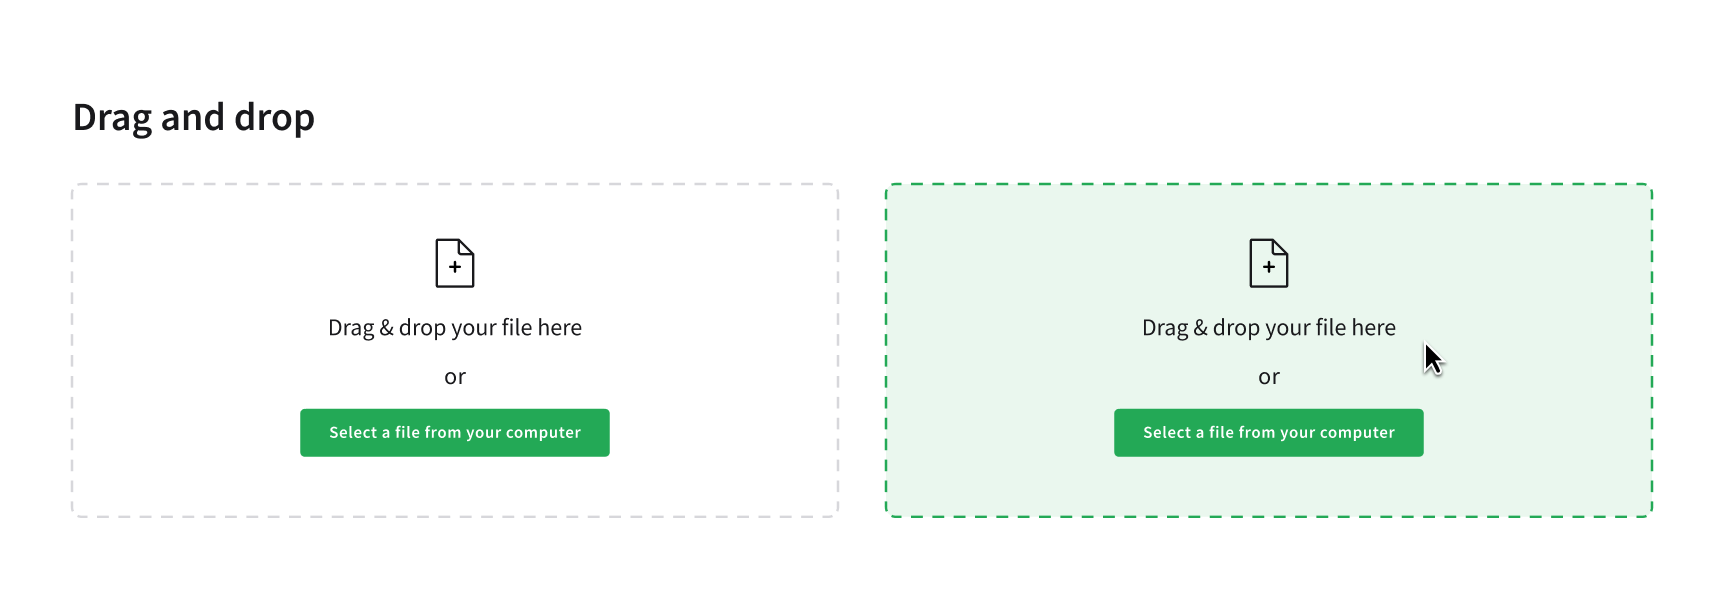
The team collaborated with several senior product designers over the years and each handoff risked pattern drift. I developed a component and pattern library which became the continuity layer: tables, graphs, navigation, modals, dropdowns, calendars, autosuggests - complex interactive components that needed to behave consistently across web and mobile regardless of who was designing.
Tokens weren't available in Figma at the time, and when variables arrived, the conversion cost outweighed the benefit - color and text styles were mostly enough. Auto-layout was a different call. Manually repositioning elements was a daily friction point with compounding cost, so the investment paid back quickly.
Workflow fit determines adoption: Check-out as a way to update inventory made sense on a whiteboard. In a kitchen mid-service, it was one step too many and got skipped most of the time. Features that replaced an existing step got used. Features that added one didn't.
Shared language is infrastructure: "Portal" vs "app", "product" vs "item" - small misalignments that create constant low-grade confusion across the team. When everyone uses different words for the same thing, conversations slow down and decisions get made on mismatched assumptions. It also matters what words you use with users. If the interface speaks a different language than they do, the friction starts before they've even clicked anything.
Early decisions have long tails: The data model, the terminology, the interaction patterns you establish in year one are still shaping the product in year five. Getting the foundations right early costs less than refactoring them later.